
I love sports. And I love data.
I’m the person at a bar who has to pretend not to be impressed when Joe Buck drops a gem like: “Paul Skenes has never struck out more than four batters in a night game on the East Coast when the temperature is below 77.3 degrees – and there were sixteen or more inches of rain in the last thirty-seven days.” My friends groan at the absurdity of it – they see that kind of noise and roll their eyes. I just think, “Wow – I wonder if that’s also why Salvy is only sporting a .240 wOBA and can’t seem to hit the ball out of the infield this week?“
I see puzzle pieces all over professional sports, and this blog is my attempt to start putting those pieces together in a way that actually makes sense and is helpful to anyone else that’s interested in this kind of stuff.
This is not a DFS projection or other gambling prediction site.
I want to get this out of the way early: While the code I’m building in my lab does provide projections, if you’re looking to make money from daily fantasy sports I would suggest going over to DailyGrind. When I play serious DFS it’s not unusual for me to have built my lineups based on the tools and projections from sites like this because they are the pros…and frankly I’m not. Occasionally my models will outperform theirs on a limited slate, but honestly mine are still a work in progress and not nearly as consistent as what you’ll find with DailyGrind.
And while you might get lucky and find a nice advantage on run line here or there using what you’ve learned, this is not about beating the odds. Sites like OddsShopper would be your better bet (pun fully intended) in that case.
That’s not to say you can’t take what you learn here and level it up to pro-level with enough time, patience and desire. One day I might do the same. But that’s not why this blog exists. It’s here for me to share my own personal learning lab with people who are interested in being a fan and digging into the data behind the players.
I just want you to be aware of that so I don’t get the hate mail from someone that tells me my model projection of Michael Lorenzen striking out 10 Reds didn’t pan out, and now they’ve had to get a fifth mortgage on the house to cover the loss. Use whatever you find here at your own risk – and have fun with it.
Welcome to my lab.
My lab is built in JupyterLab. I learned Python a few years ago as part of a University of Kansas data analytics program (Rock Chalk Jayhawk!), and I discovered Jupyter Notebook not long after that. I’ve since migrated into JupyterLab which is a more robust environment using notebooks which form the core of what I do. Most (if not all) of what I’m going to show you here is notebook-based.
If you’re not familiar with either of those tools I strongly encourage you to check them out – notebooks are gaining a lot of popularity in enterprises, and you can even try them out in your browser first. Check out Project Jupyter for more information around them. They’re easy to set up; the only challenge I ran into was in getting my file system environment set the way I wanted – but once I got over that everything has been smooth sailing.
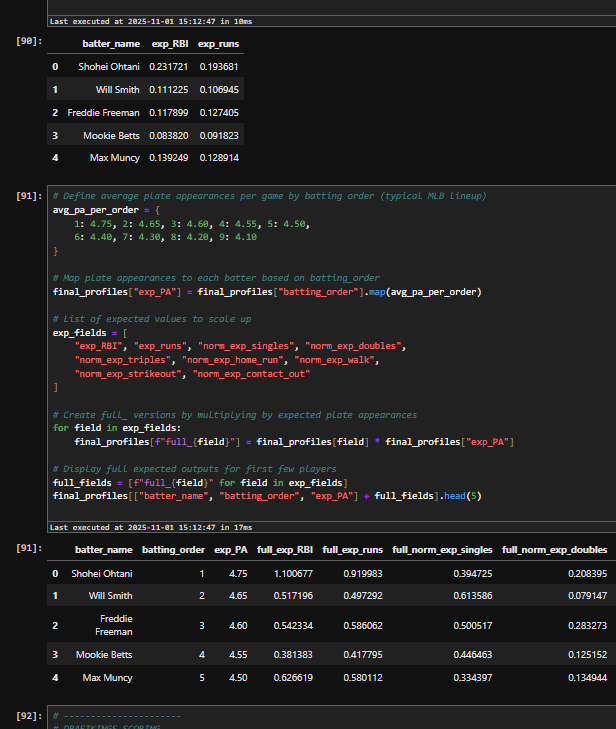
Below is a snapshot of some live code I have in one of my working notebooks – you can see outputs in the same document as the code.
I use Pandas as my backbone for data frames – I know there are alternatives like Polars (which have shown significant speed improvements), but I grew up in Pandas and am more interested at this point in continuing to augment my models than rebuilding it for speed. As it is the models run relatively quickly so I’m not feeling the pain of processing lags…yet, anyway. (note: if the rest of this paragraph doesn’t make any sense to you that’s absolutely OK – we’ll get into what it means as we dig into the model)
And the core for my data comes from publicly available sources; I don’t subscribe to any aggregated data providers. I used to, but I found I could get richer information faster if I built it myself with some code and help from generative AI (yes, I use tools like ChatGPT, Gemini and Claude – they’ve saved me a ton of time and I’m a huge proponent of them for all sorts of applications, including coding assistance). We’ll dig into specifics as we get into various sports, but if you want a head start on my favorite sport (baseball) check out this site which leverages MLB Statcast data.
We’ll jump into more details next time. This is the first of what will probably be a ten-part series, with the first seven posts (including this one) dedicated to creating a live MLB model, and then the following three delving into some other areas of modeling (different sports, different approaches, etc.).
I hope you stick with me; we’re going to get into some code starting in the next post and then really hit it after that. You can sign up for the newsletter to be reminded when the next post is up or just bookmark the site and come back to it periodically.
Thanks for dropping by – I look forward to this journey with you!
Affiliate Disclosure: I’m a big fan of transparency, so I want to make sure you know that on this site you may find certain links to products or services that I’m an affiliate of. This means I may make a commission for any purchases you make using those links. If you are not comfortable with that that’s completely fine – you can feel free to find the same product or service other ways and it won’t hurt my feelings. I keep my affiliate links minimal and use them only as an opportunity to help offset costs while helping others.

Leave a comment